Note
Go to the end to download the full example code.
Show basic filtering capabilities.
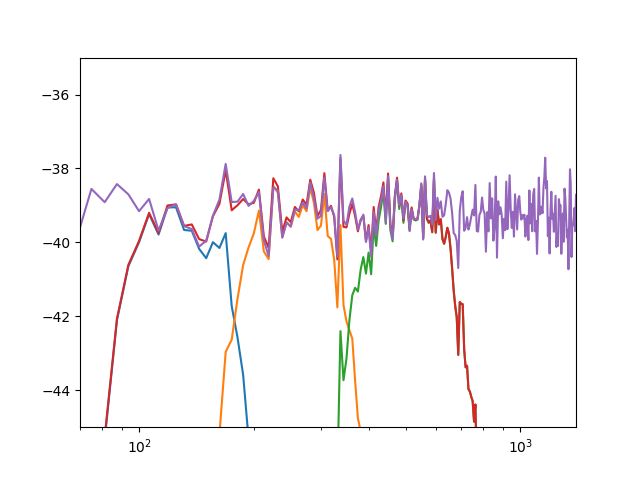
Demonstrates band pass filter characteristics and shows
unfiltered power spectrum
three adjacent octave bands filtered spectra
sum of all octave band spectra

import acoular as ac
import matplotlib.pyplot as plt
import numpy as np

ac.config.global_caching = 'none'
num_samples = 51200 * 10
n1 = ac.WNoiseGenerator(sample_freq=51200, num_samples=num_samples, seed=1)
m1 = ac.MicGeom(pos_total=[[1], [1], [1]])
p1 = ac.PointSource(signal=n1, mics=m1)
f1 = ac.FiltFiltOctave(source=p1, band=10, fraction='Octave')
hs = 0.0
res0 = 0.0
for i in np.arange(2.1, 3.0, 0.3):
    # f1.order = 2
    f1.band = 10**i
    res = (ac.tools.return_result(f1) ** 2).sum()
    res0 += res
    ps = ac.PowerSpectra(source=f1, block_size=8192)
    # print(res / num_samples, ps.csm[:, 0, 0].real.sum())
    x = ps.fftfreq()
    y = 10 * np.log10(ps.csm[:, 0, 0].real)
    plt.semilogx(x, y)
    hs = hs + ps.csm[:, 0, 0].real
y = 10 * np.log10(abs(hs))
plt.semilogx(x, y)
ps = ac.PowerSpectra(source=p1, block_size=8192)
x = ps.fftfreq()
y = 10 * np.log10(ps.csm[:, 0, 0].real)
plt.semilogx(x, y)
plt.ylim(-45, -35)
plt.xlim(70, 1400)
plt.show()
Total running time of the script: (0 minutes 1.209 seconds)
